In this tutorial you'll get a full tour through Keptn. Before we get started you'll get to know what you will learn while you walk yourself through this tutorial.
What we will cover
- How to create a sample project
- How to onboard a first microservice
- How to deploy your first microservice with blue/green deployments
- How to setup quality gates
- How to prevent bad builds of your microservice to reach production
- How to integrate other tools like Slack, MS Team, etc in your Keptn integration
You'll find a time estimate until the end of this tutorial in the right top corner of your screen - this should give you guidance how much time is needed for each step.
In this tutorial, we are going to install Keptn on a Kubernetes cluster, along with Istio for traffic routing and ingress control.
- Keptn as a control-plane for continuous delivery and automated operations
- Istio as the ingress and service mesh within the cluster for traffic routing between blue/green versions of our services
The full setup that we are going to deploy is sketched in the following image.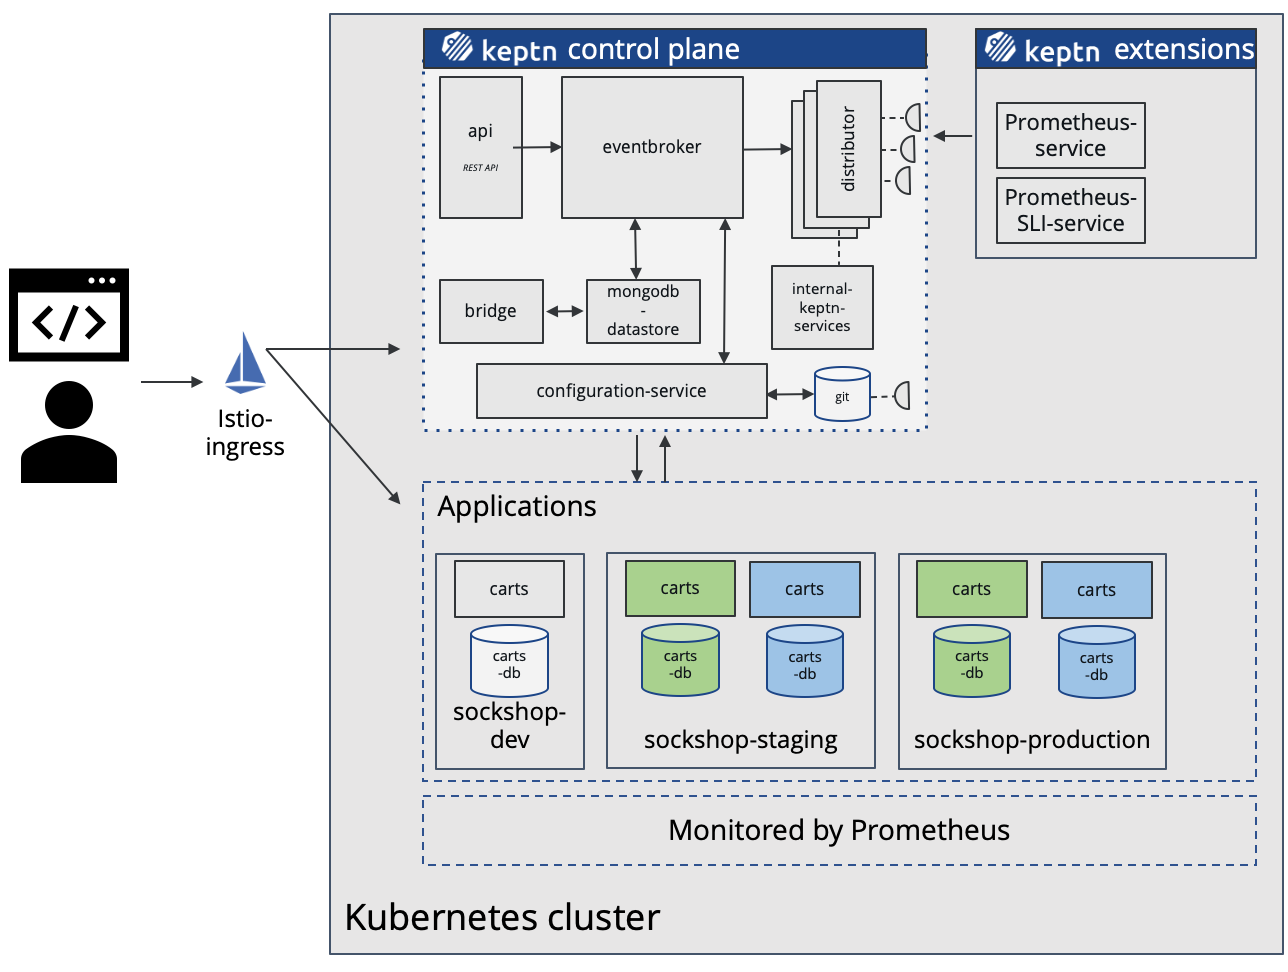
Keptn can be installed on a variety of Kubernetes distributions. Please find a full compatibility matrix for supported Kubernetes versions here.
Please find tutorials how to set up your cluster here. For the best tutorial experience, please follow the sizing recommendations given in the tutorials.
Please make sure your environment matches these prerequisites:
- kubectl
- Linux or MacOS (preferred as some instructions are targeted for these platforms)
- On Windows: Git Bash 4 Windows, WSL
Download the Istio command line tool by following the official instructions or by executing the following steps.
curl -L https://istio.io/downloadIstio | ISTIO_VERSION=1.11.2 sh -
Check the version of Istio that has been downloaded and execute the installer from the corresponding folder, e.g.:
./istio-1.11.2/bin/istioctl install
The installation of Istio should be finished within a couple of minutes.
This will install the Istio default profile with ["Istio core" "Istiod" "Ingress gateways"] components into the cluster. Proceed? (y/N) y
✔ Istio core installed
✔ Istiod installed
✔ Ingress gateways installed
✔ Installation complete
Every release of Keptn provides binaries for the Keptn CLI. These binaries are available for Linux, macOS, and Windows.
There are multiple options how to get the Keptn CLI on your machine.
- Easiest option (works on Linux, Mac OS, Windows with Bash and WSL2):
This will download and install the Keptn CLI in the specified version automatically.curl -sL https://get.keptn.sh | KEPTN_VERSION=0.9.0 bash - Using HomeBrew (on MacOs):
brew install keptn - Another option is to manually download the current release of the Keptn CLI:
- Download the version for your operating system and architecture from Download CLI
- Unpack the download
- Find the
keptnbinary (e.g.,keptn-0.9.0-amd64.exe) in the unpacked directory and rename it tokeptn - Linux / macOS: Add executable permissions (
chmod +x keptn), and move it to the desired destination (e.g.mv keptn /usr/local/bin/keptn)
- Windows: Copy the executable to the desired folder and add the executable to your PATH environment variable.
Now, you should be able to run the Keptn CLI:
- Linux / macOS
keptn --help - Windows
.\keptn.exe --help
To install the latest release of Keptn with full quality gate + continuous delivery capabilities in your Kubernetes cluster, execute the keptn install command.
keptn install --endpoint-service-type=ClusterIP --use-case=continuous-delivery
Installation details
By default Keptn installs into the keptn namespace. Once the installation is complete we can verify the deployments:
kubectl get deployments -n keptn
Here is the output of the command:
NAME                          READY   UP-TO-DATE   AVAILABLE   AGE
api-gateway-nginx             1/1     1            1           2m44s
api-service                   1/1     1            1           2m44s
approval-service              1/1     1            1           2m44s
bridge                        1/1     1            1           2m44s
configuration-service         1/1     1            1           2m44s
helm-service                  1/1     1            1           2m44s
jmeter-service                1/1     1            1           2m44s
lighthouse-service            1/1     1            1           2m44s
litmus-service                1/1     1            1           2m44s
mongodb                       1/1     1            1           2m44s
mongodb-datastore             1/1     1            1           2m44s
remediation-service           1/1     1            1           2m44s
shipyard-controller           1/1     1            1           2m44s
statistics-service            1/1     1            1           2m44s
We are using Istio for traffic routing and as an ingress to our cluster. To make the setup experience as smooth as possible we have provided some scripts for your convenience. If you want to run the Istio configuration yourself step by step, please take a look at the Keptn documentation.
The first step for our configuration automation for Istio is downloading the configuration bash script from Github:
curl -o configure-istio.sh https://raw.githubusercontent.com/keptn/examples/release-0.9.0/istio-configuration/configure-istio.sh
After that you need to make the file executable using the chmod command.
chmod +x configure-istio.sh
Finally, let's run the configuration script to automatically create your Ingress resources.
./configure-istio.sh
What is actually created
With this script, you have created an Ingress based on the following manifest.
---
apiVersion: networking.k8s.io/v1
kind: Ingress
metadata:
  annotations:
    kubernetes.io/ingress.class: istio
  name: api-keptn-ingress
  namespace: keptn
spec:
  rules:
  - host: <IP-ADDRESS>.nip.io
    http:
      paths:
      - path: /
        pathType: Prefix
        backend:
          service:
            name: api-gateway-nginx
            port:
              number: 80
Please be aware, when using OpenShift 3.11, instead of using the above manifest, use the following one, as it uses an already deprecated apiVersion.
---
apiVersion: networking.k8s.io/v1beta1
kind: Ingress
metadata:
  annotations:
    kubernetes.io/ingress.class: istio
  name: api-keptn-ingress
  namespace: keptn
spec:
  rules:
  - host: <IP-ADDRESS>.nip.io
    http:
      paths:
      - backend:
          serviceName: api-gateway-nginx
          servicePort: 80
In addition, the script has created a gateway resource for you so that the onboarded services are also available publicly.
---
apiVersion: networking.istio.io/v1alpha3
kind: Gateway
metadata:
  name: public-gateway
  namespace: istio-system
spec:
  selector:
    istio: ingressgateway
  servers:
  - port:
      name: http
      number: 80
      protocol: HTTP
    hosts:
    - '*'
Finally, the script restarts the helm-service pod of Keptn to fetch this new configuration.
In this section we are referring to the Linux/MacOS derivatives of the commands. If you are using a Windows host, please follow the official instructions.
First let's extract the information used to access the Keptn installation and store this for later use.
KEPTN_ENDPOINT=http://$(kubectl -n keptn get ingress api-keptn-ingress -ojsonpath='{.spec.rules[0].host}')/api
KEPTN_API_TOKEN=$(kubectl get secret keptn-api-token -n keptn -ojsonpath='{.data.keptn-api-token}' | base64 --decode)
KEPTN_BRIDGE_URL=http://$(kubectl -n keptn get ingress api-keptn-ingress -ojsonpath='{.spec.rules[0].host}')/bridge
Use this stored information and authenticate the CLI.
keptn auth --endpoint=$KEPTN_ENDPOINT --api-token=$KEPTN_API_TOKEN
That will give you:
Starting to authenticate
Successfully authenticated
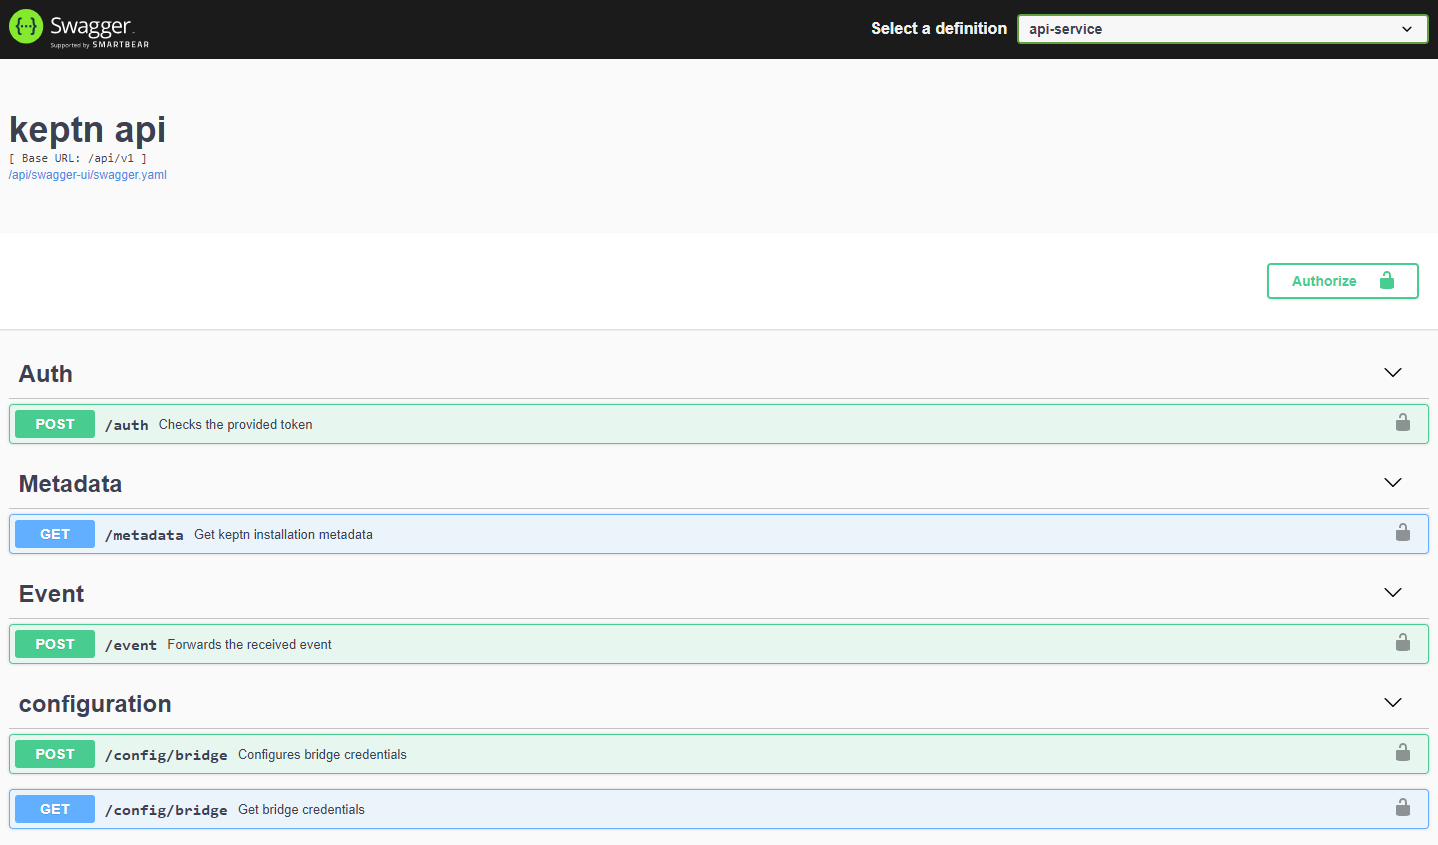
If you want, you can go ahead and take a look at the Keptn API by navigating to the endpoint that is given via:
echo $KEPTN_ENDPOINT
A project in Keptn is the logical unit that can hold multiple (micro)services. Therefore, it is the starting point for each Keptn installation.
To get all files you need for this tutorial, please clone the example repo to your local machine.
git clone --branch release-0.9.1 https://github.com/keptn/examples.git --single-branch

cd examples/onboarding-carts
Create a new project for your services using the keptn create project command. In this example, the project is called sockshop. Before executing the following command, make sure you are in the examples/onboarding-carts folder.
Recommended: Create a new project with Git upstream:
To configure a Git upstream for this tutorial, the Git user (--git-user), an access token (--git-token), and the remote URL (--git-remote-url) are required. If a requirement is not met, go to the Keptn documentation where instructions for GitHub, GitLab, and Bitbucket are provided.
Let's define the variables before running the command:
GIT_USER=gitusername
GIT_TOKEN=gittoken
GIT_REMOTE_URL=remoteurl
Now let's create the project using the keptn create project command.
keptn create project sockshop --shipyard=./shipyard.yaml --git-user=$GIT_USER --git-token=$GIT_TOKEN --git-remote-url=$GIT_REMOTE_URL
Alternatively: If you don't want to use a Git upstream, you can create a new project without it but please note that this is not the recommended way:
keptn create project sockshop --shipyard=./shipyard.yaml
For creating the project, the tutorial relies on a shipyard.yaml file as shown below:
apiVersion: "spec.keptn.sh/0.2.0"
kind: "Shipyard"
metadata:
  name: "shipyard-sockshop"
spec:
  stages:
    - name: "dev"
      sequences:
        - name: "delivery"
          tasks:
            - name: "deployment"
              properties:
                deploymentstrategy: "direct"
            - name: "test"
              properties:
                teststrategy: "functional"
            - name: "evaluation"
            - name: "release"
        - name: "delivery-direct"
          tasks:
            - name: "deployment"
              properties:
                deploymentstrategy: "direct"
            - name: "release"

    - name: "staging"
      sequences:
        - name: "delivery"
          triggeredOn:
            - event: "dev.delivery.finished"
          tasks:
            - name: "deployment"
              properties:
                deploymentstrategy: "blue_green_service"
            - name: "test"
              properties:
                teststrategy: "performance"
            - name: "evaluation"
            - name: "release"
        - name: "rollback"
          triggeredOn:
            - event: "staging.delivery.finished"
              selector:
                match:
                  result: "fail"
          tasks:
            - name: "rollback"
        - name: "delivery-direct"
          triggeredOn:
            - event: "dev.delivery-direct.finished"
          tasks:
            - name: "deployment"
              properties:
                deploymentstrategy: "direct"
            - name: "release"

    - name: "production"
      sequences:
        - name: "delivery"
          triggeredOn:
            - event: "staging.delivery.finished"
          tasks:
            - name: "deployment"
              properties:
                deploymentstrategy: "blue_green_service"
            - name: "release"
        - name: "rollback"
          triggeredOn:
            - event: "production.delivery.finished"
              selector:
                match:
                  result: "fail"
          tasks:
            - name: "rollback"
        - name: "delivery-direct"
          triggeredOn:
            - event: "staging.delivery-direct.finished"
          tasks:
            - name: "deployment"
              properties:
                deploymentstrategy: "direct"
            - name: "release"

        - name: "remediation"
          triggeredOn:
            - event: "production.remediation.finished"
              selector:
                match:
                  evaluation.result: "fail"
          tasks:
            - name: "get-action"
            - name: "action"
            - name: "evaluation"
              triggeredAfter: "15m"
              properties:
                timeframe: "15m"
This shipyard contains three stages: dev, staging, and production. Later in the tutorial, deployments will be made in three corresponding Kubernetes namespaces: sockshop-dev, sockshop-staging, and sockshop-production.
- dev will have a direct (big bang) deployment strategy and functional tests are executed
- staging will have a blue/green deployment strategy with automated approvals for passing quality gates as well as quality gates which result in warnings. As configured, performance tests are executed.
- production will have a blue/green deployment strategy without any further testing. Approvals are done automatically for passed quality gates but manual approval is needed for quality gate evaluations that result in a warning. The configured remediation strategy is used for self-healing in production.
Let's take a look at the project that we have just created in the Keptn's Bridge. To access it, visit the URL contained in $KEPTN_BRIDGE_URL using the command:
echo $KEPTN_BRIDGE_URL
You can view the Keptn Bridge credentials using the following commands:
echo Username: $(kubectl get secret -n keptn bridge-credentials -o jsonpath="{.data.BASIC_AUTH_USERNAME}" | base64 --decode)
echo Password: $(kubectl get secret -n keptn bridge-credentials -o jsonpath="{.data.BASIC_AUTH_PASSWORD}" | base64 --decode)
You will find the just created project in the bridge with all stages.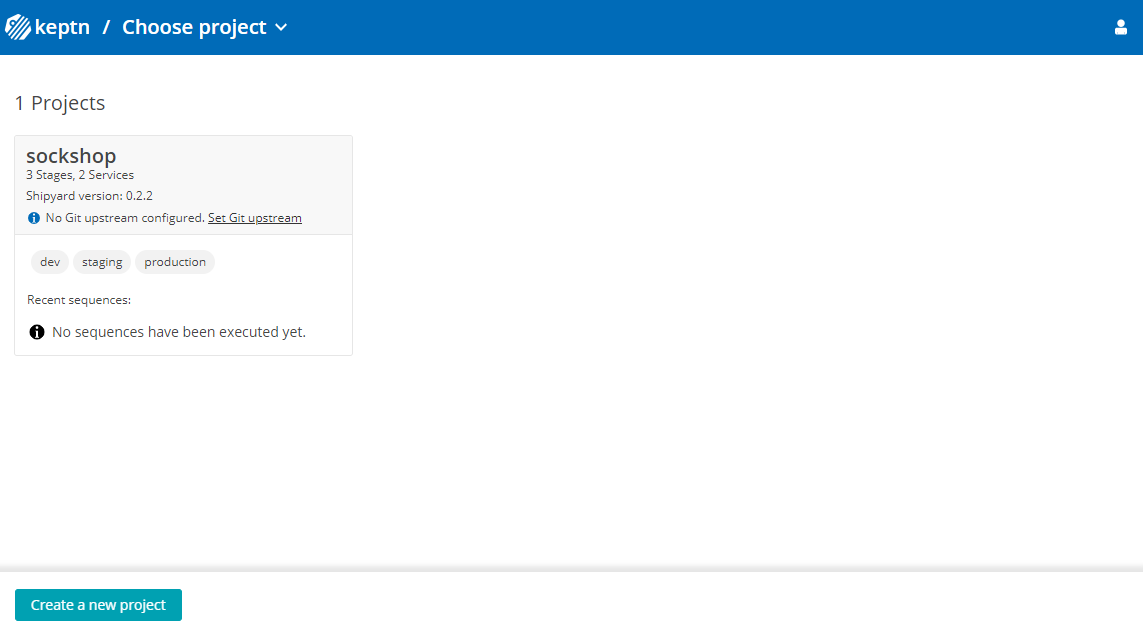
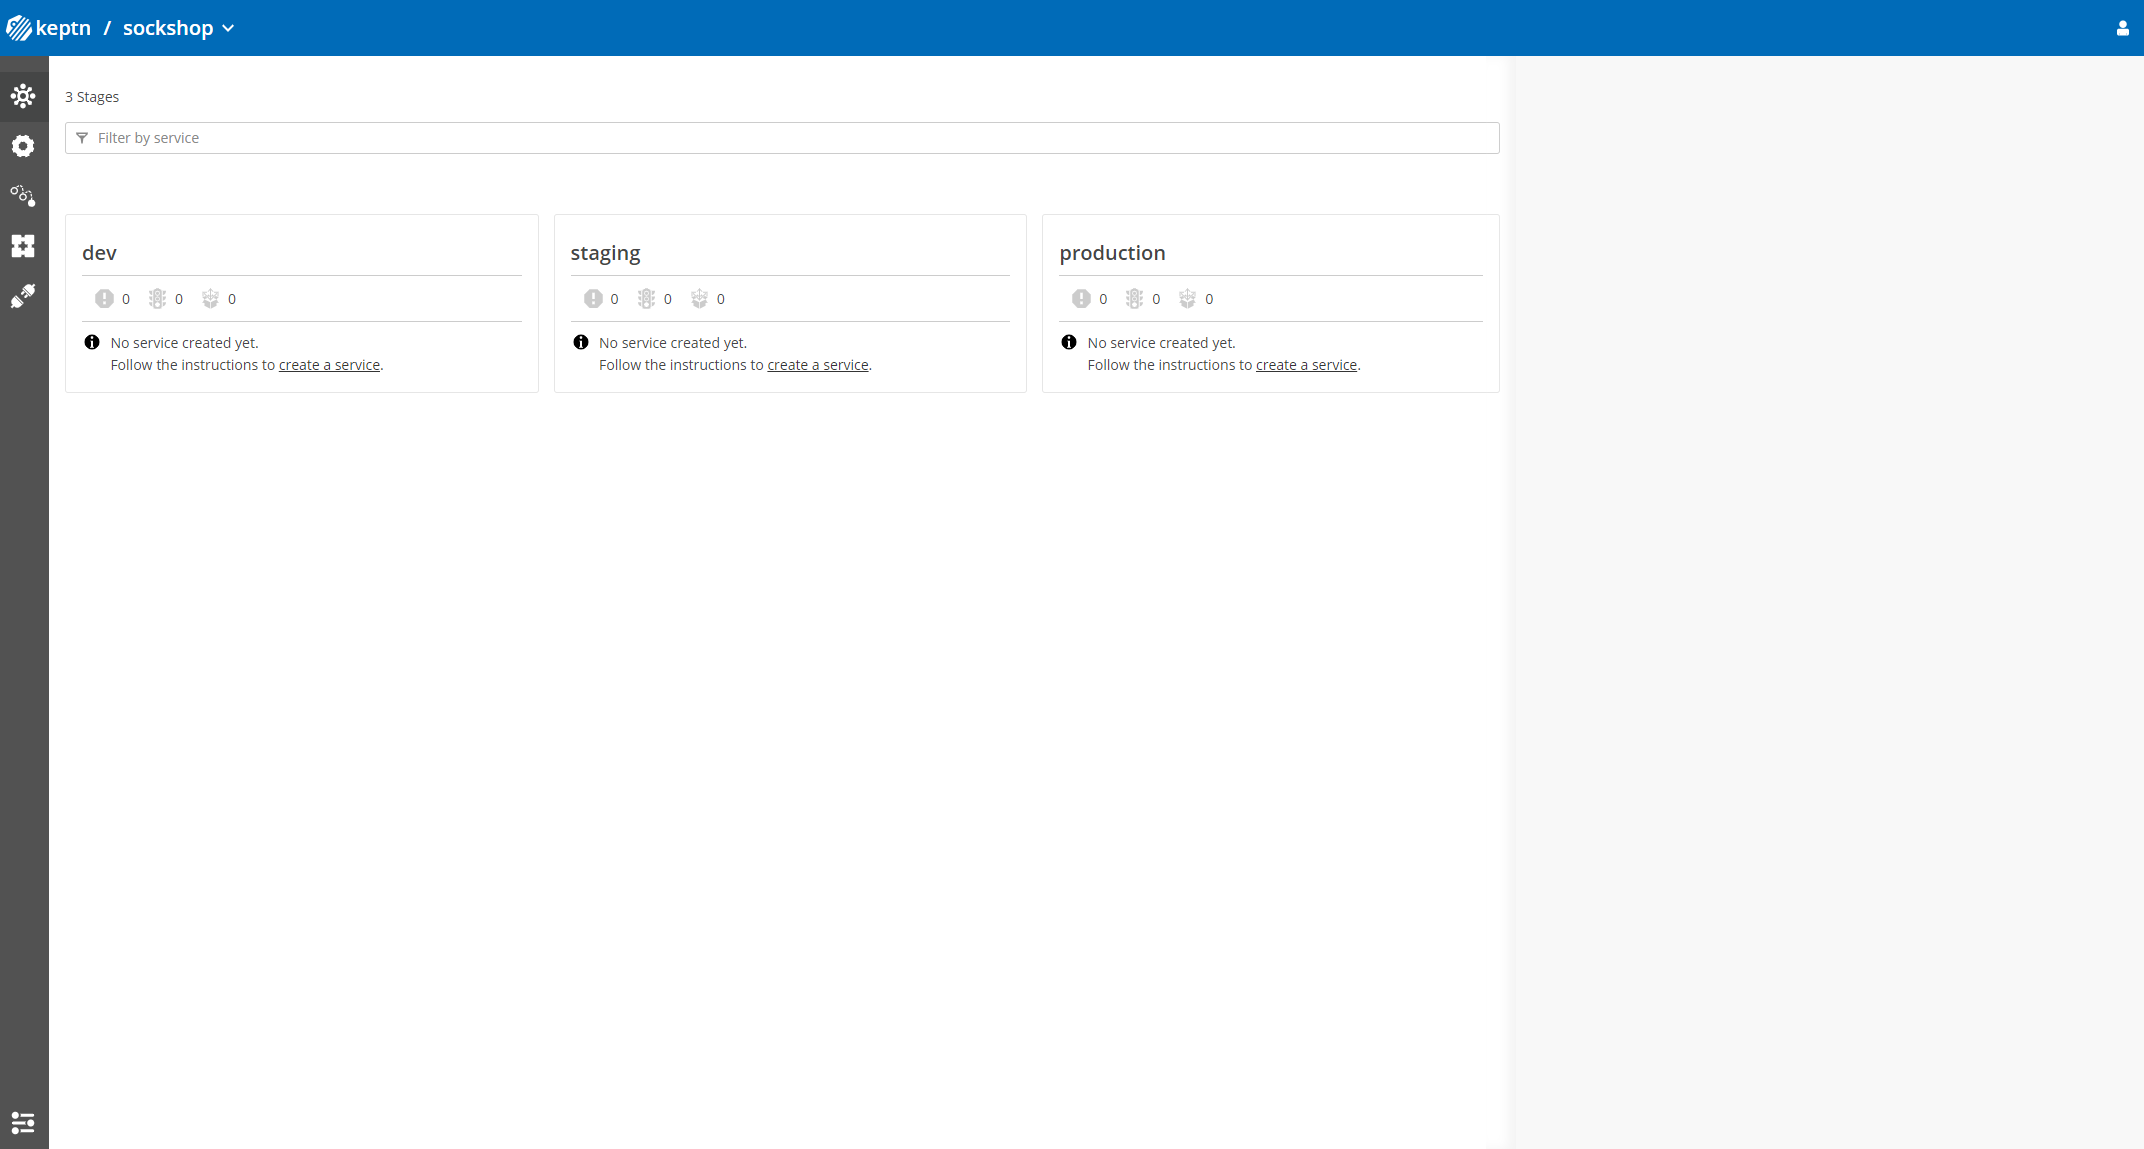
After creating the project, services can be created for our project.
- Create the carts service using the keptn create service and keptn add-resourcecommands:
keptn create service carts --project=sockshop keptn add-resource --project=sockshop --service=carts --all-stages --resource=./carts.tgz --resourceUri=helm/carts.tgz - After creating the service, tests (i.e., functional- and performance tests) need to be added as basis for quality gates in the different stages:
- Functional tests for dev stage:
keptn add-resource --project=sockshop --stage=dev --service=carts --resource=jmeter/basiccheck.jmx --resourceUri=jmeter/basiccheck.jmx- Performance tests for staging stage:
Note: You can adapt the tests inkeptn add-resource --project=sockshop --stage=staging --service=carts --resource=jmeter/load.jmx --resourceUri=jmeter/load.jmxbasiccheck.jmxas well asload.jmxfor your service. However, you must not rename the files because there is a hardcoded dependency on these file names in the current implementation of Keptn's jmeter-service.
Since the carts service requires a mongodb database, a second service needs to be created.
- Create the carts-db service using the keptn create service and keptn add-resourcecommands.
keptn create service carts-db --project=sockshop
keptn add-resource --project=sockshop --service=carts-db --all-stages --resource=./carts-db.tgz --resourceUri=helm/carts-db.tgz
Take a look in your Keptn's Bridge and see the newly created services.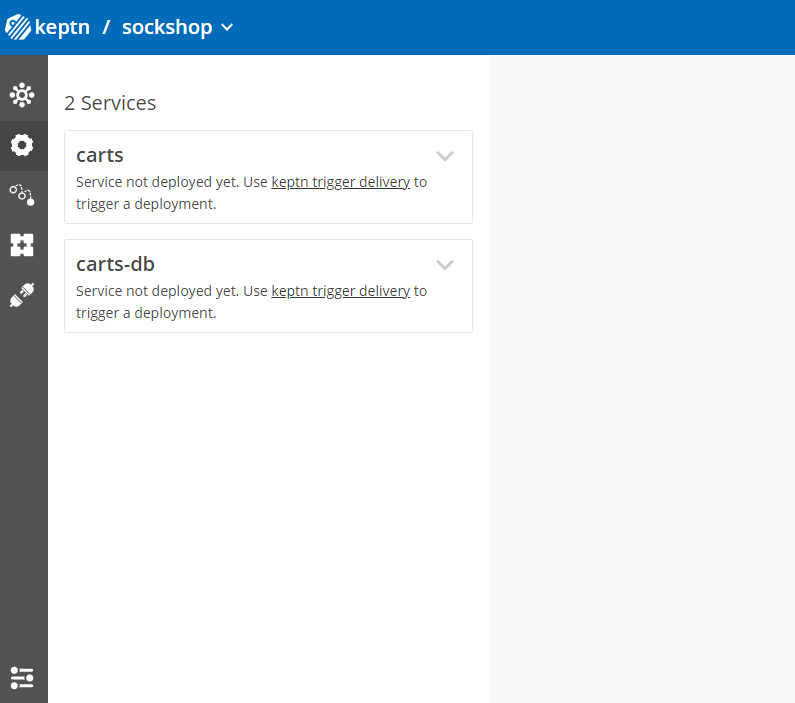
After creating the services, a built artifact of each service can be deployed.
- Deploy the carts-db service by executing the keptn trigger delivery command:
keptn trigger delivery --project=sockshop --service=carts-db --image=docker.io/mongo --tag=4.2.2 --sequence=delivery-direct - Deploy the carts service by specifying the built artifact, which is stored on DockerHub and tagged with version 0.13.1:
keptn trigger delivery --project=sockshop --service=carts --image=docker.io/keptnexamples/carts --tag=0.13.1 - Go to Keptn's Bridge and check which events have already been generated.
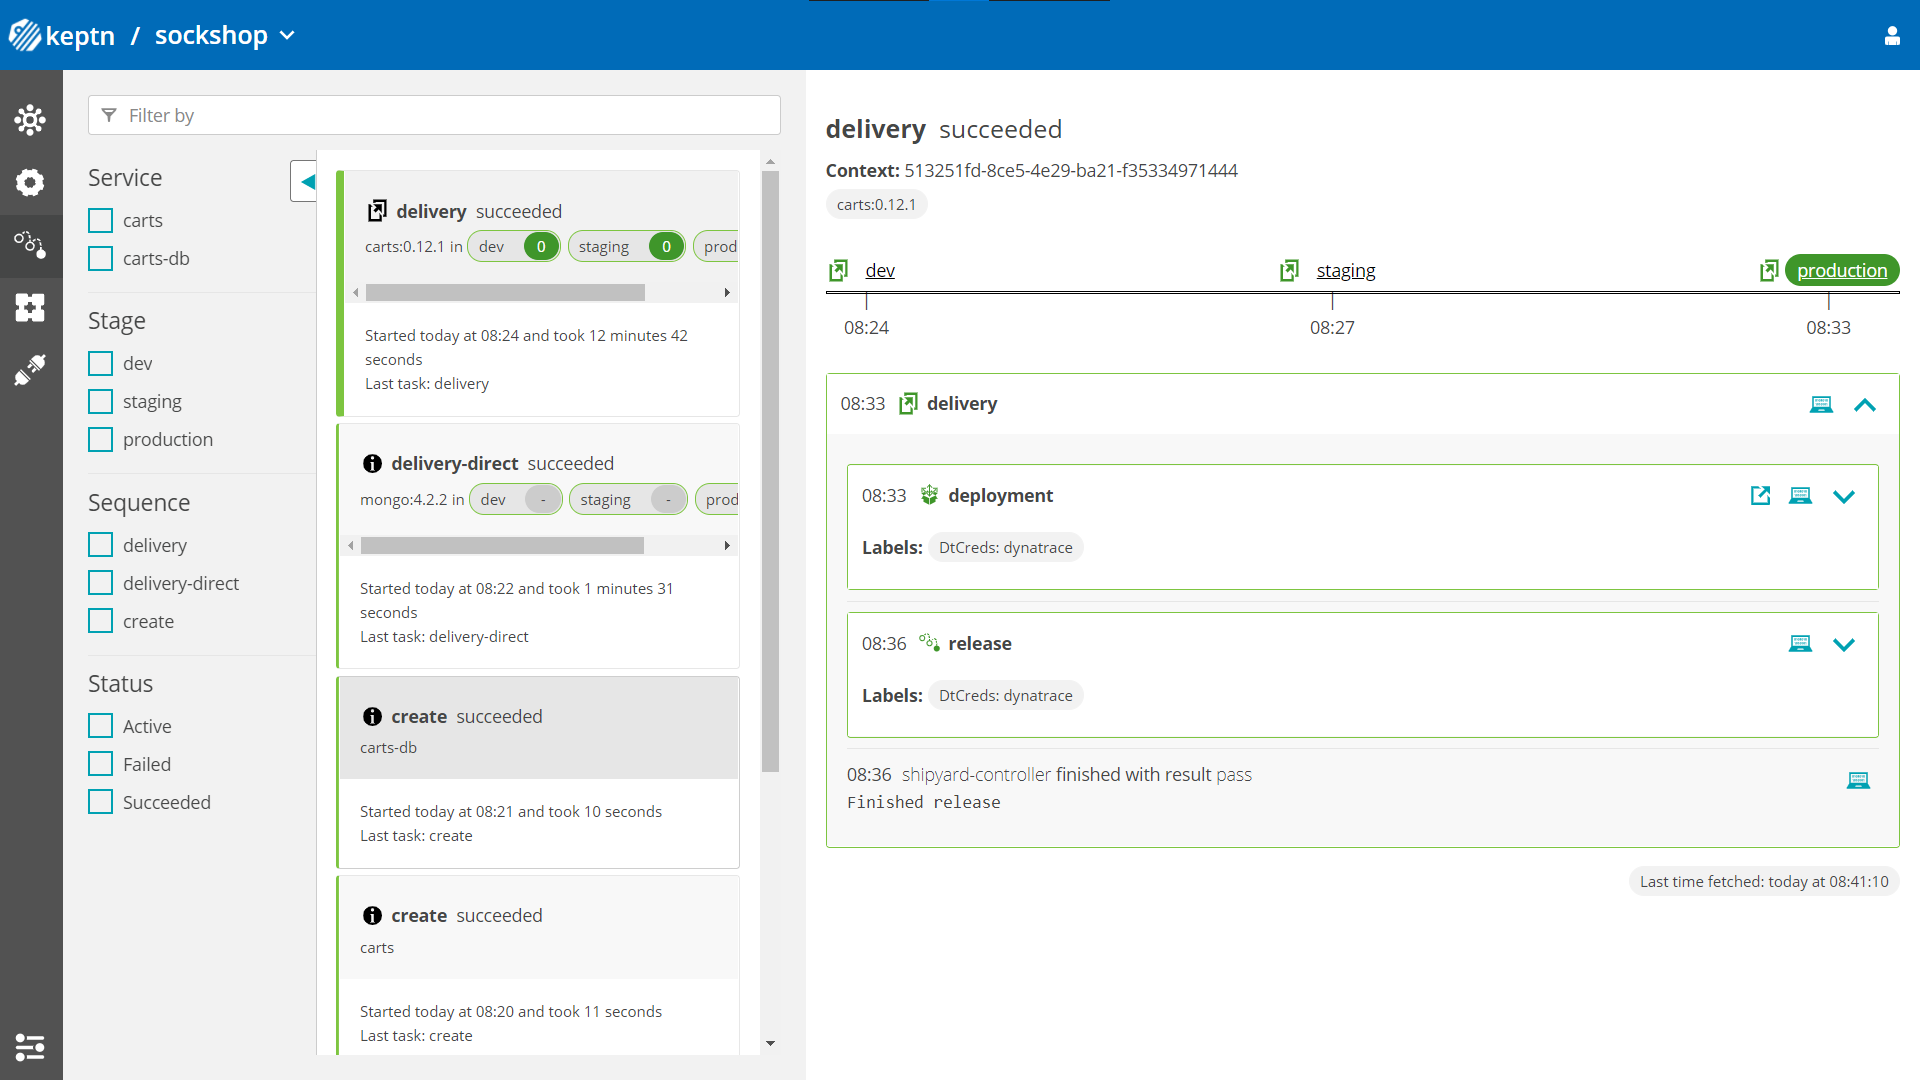
- Optional: Verify the pods that should have been created for services carts and carts-db:
kubectl get pods --all-namespaces | grep carts-sockshop-dev carts-77dfdc664b-25b74 1/1 Running 0 10m sockshop-dev carts-db-54d9b6775-lmhf6 1/1 Running 0 13m sockshop-production carts-db-54d9b6775-4hlwn 2/2 Running 0 12m sockshop-production carts-primary-79bcc7c99f-bwdhg 2/2 Running 0 2m15s sockshop-staging carts-db-54d9b6775-rm8rw 2/2 Running 0 12m sockshop-staging carts-primary-79bcc7c99f-mbbgq 2/2 Running 0 7m24s
- Get the URL for your carts service with the following commands in the respective namespaces:
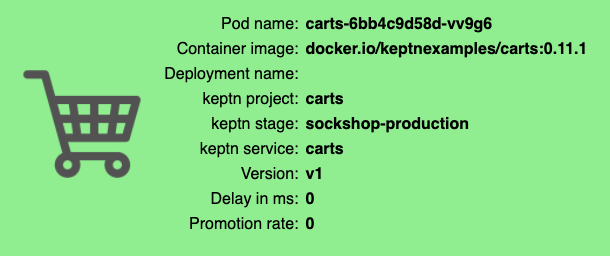
echo http://carts.sockshop-dev.$(kubectl -n keptn get ingress api-keptn-ingress -ojsonpath='{.spec.rules[0].host}')echo http://carts.sockshop-staging.$(kubectl -n keptn get ingress api-keptn-ingress -ojsonpath='{.spec.rules[0].host}')echo http://carts.sockshop-production.$(kubectl -n keptn get ingress api-keptn-ingress -ojsonpath='{.spec.rules[0].host}') - Navigate to the URLs to inspect the carts service. In the production namespace, you should receive an output similar to this:
Now that the service is running in all three stages, let us generate some traffic so we have some data we can base the evaluation on.
Change the directory to examples/load-generation/cartsloadgen. If you are still in the onboarding-carts directory, use the following command or change it accordingly:
cd ../load-generation/cartsloadgen
Now let us deploy a pod that will generate some traffic for all three stages of our demo environment.
kubectl apply -f deploy/cartsloadgen-base.yaml
The output will look similar to this.
namespace/loadgen created
deployment.extensions/cartsloadgen created
Optionally, you can verify that the load generator has been started.
kubectl get pods -n loadgen
NAME                            READY   STATUS    RESTARTS   AGE
cartsloadgen-5dc47c85cf-kqggb   1/1     Running   0          117s
After creating a project and service, you can set up Prometheus monitoring and configure scrape jobs using the Keptn CLI.
Keptn doesn't install or manage Prometheus and its components. Users need to install Prometheus and Prometheus Alert manager as a prerequisite.
- To install the Prometheus and Alert Manager, execute:
kubectl create ns monitoring
helm repo add prometheus-community https://prometheus-community.github.io/helm-charts
helm install prometheus prometheus-community/prometheus --namespace monitoring
Execute the following steps to install prometheus-service
- Download the Keptn's Prometheus service manifest
kubectl apply -f https://raw.githubusercontent.com/keptn-contrib/prometheus-service/release-0.7.0/deploy/service.yaml - Replace the environment variable value according to the use case and apply the manifest
# Prometheus installed namespace kubectl set env deployment/prometheus-service -n keptn --containers="prometheus-service" PROMETHEUS_NS="monitoring" # Setup Prometheus Endpoint kubectl set env deployment/prometheus-service -n keptn --containers="prometheus-service" PROMETHEUS_ENDPOINT="http://prometheus-server.monitoring.svc.cluster.local:80" # Alert Manager installed namespace kubectl set env deployment/prometheus-service -n keptn --containers="prometheus-service" ALERT_MANAGER_NS="monitoring" - Install Role and Rolebinding to permit Keptn's prometheus-service for performing operations in the Prometheus installed namespace.
kubectl apply -f https://raw.githubusercontent.com/keptn-contrib/prometheus-service/release-0.7.0/deploy/role.yaml -n monitoring - Execute the following command to install Prometheus and set up the rules for the Prometheus Alerting Manager:
keptn configure monitoring prometheus --project=sockshop --service=carts
Optional: Verify Prometheus setup in your cluster
- To verify that the Prometheus scrape jobs are correctly set up, you can access Prometheus by enabling port-forwarding for the prometheus-service:
kubectl port-forward svc/prometheus-server 8080:80 -n monitoring
Prometheus is then available on localhost:8080/targets where you can see the targets for the service: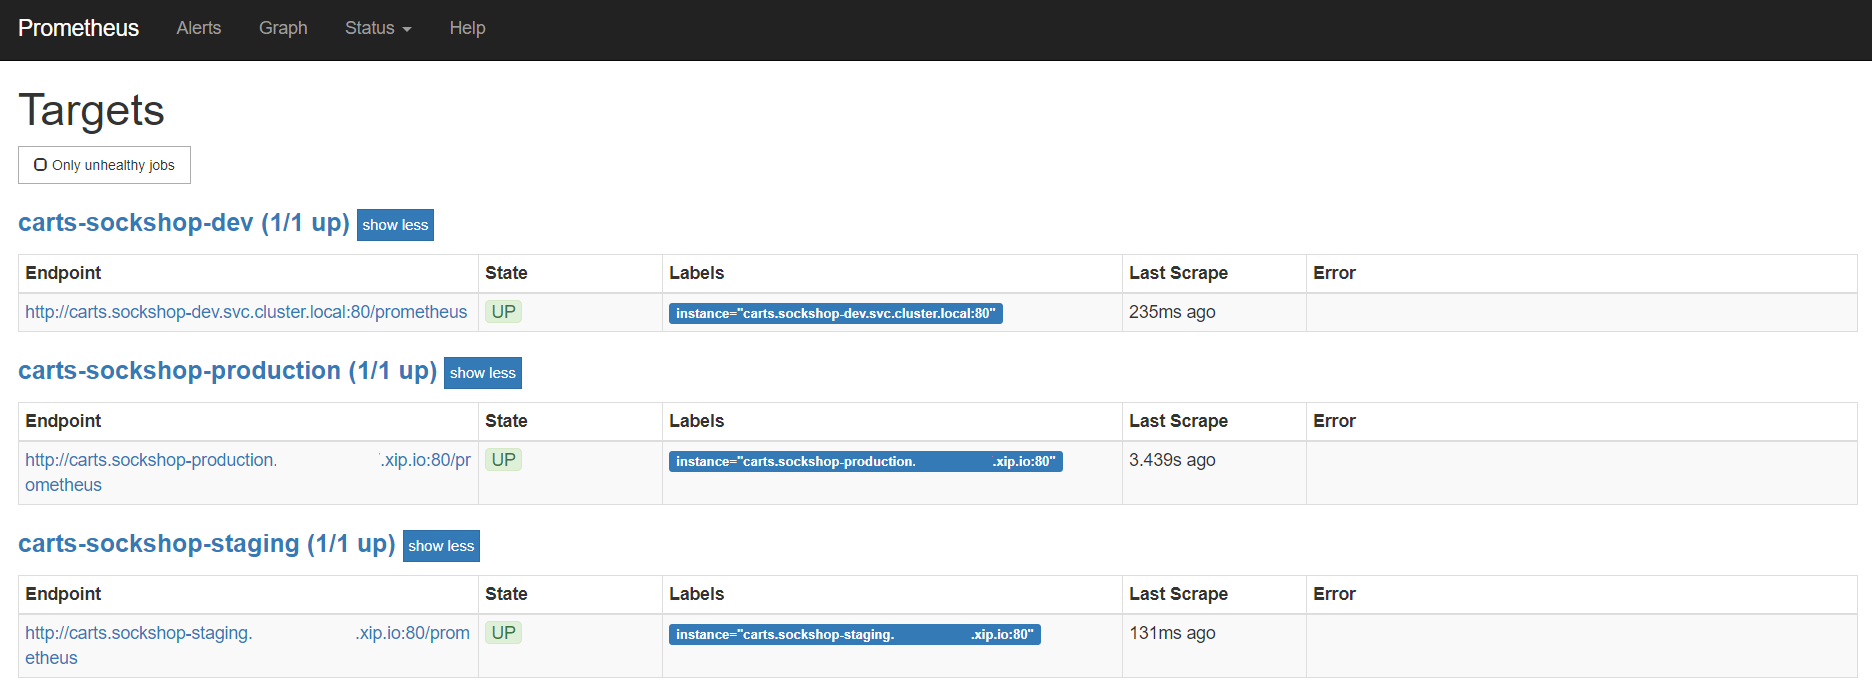
We are going to add the configuration for our SLIs in terms of an SLI file that maps the name of an indicator to a PromQL statement how to actually query it. Please make sure you are in the correct folder examples/onboarding-carts.
Prometheus SLI provider
During the evaluation of a quality gate, the Prometheus provider is required that is implemented by an internal Keptn service, the prometheus-service. This service will fetch the values for the SLIs that are referenced in an SLO configuration file.
We are going to add the configuration for our SLIs in terms of an SLI file that maps the name of an indicator to a PromQL statement how to actually query it. Please make sure you are in the correct folder examples/onboarding-carts.
keptn add-resource --project=sockshop --stage=staging --service=carts --resource=sli-config-prometheus-bg.yaml --resourceUri=prometheus/sli.yaml
For your information, the contents of the file are as follows:
---
spec_version: '1.0'
indicators:
  response_time_p50: histogram_quantile(0.5, sum by(le) (rate(http_response_time_milliseconds_bucket{handler="ItemsController.addToCart",job="$SERVICE-$PROJECT-$STAGE-canary"}[$DURATION_SECONDS])))
  response_time_p90: histogram_quantile(0.9, sum by(le) (rate(http_response_time_milliseconds_bucket{handler="ItemsController.addToCart",job="$SERVICE-$PROJECT-$STAGE-canary"}[$DURATION_SECONDS])))
  response_time_p95: histogram_quantile(0.95, sum by(le) (rate(http_response_time_milliseconds_bucket{handler="ItemsController.addToCart",job="$SERVICE-$PROJECT-$STAGE-canary"}[$DURATION_SECONDS])))
Keptn requires a performance specification for the quality gate. This specification is described in a file called slo.yaml, which specifies a Service Level Objective (SLO) that should be met by a service. To learn more about the slo.yaml file, go to Specifications for Site Reliability Engineering with Keptn.
To activate the quality gates for the carts service, navigate to the examples/onboarding-carts folder and upload the slo-quality-gates.yaml file using the add-resource command:
keptn add-resource --project=sockshop --stage=staging --service=carts --resource=slo-quality-gates.yaml --resourceUri=slo.yaml
This will add the SLO.yaml file to your Keptn - which is the declarative definition of a quality gate. Let's take a look at the file contents:
---
spec_version: "1.0"
comparison:
  aggregate_function: "avg"
  compare_with: "single_result"
  include_result_with_score: "pass"
  number_of_comparison_results: 1
filter:
objectives:
  - sli: "response_time_p95"
    key_sli: false
    pass:             # pass if (relative change <= 10% AND absolute value is < 600ms)
      - criteria:
          - "<=+10%"  # relative values require a prefixed sign (plus or minus)
          - "<600"    # absolute values only require a logical operator
    warning:          # if the response time is below 800ms, the result should be a warning
      - criteria:
          - "<=800"
    weight: 1
total_score:
  pass: "90%"
  warning: "75%"
You can take a look at the currently deployed version of our "carts" microservice before we deploy the next build of our microservice.
- Get the URL for your carts service with the following commands in the respective stages:
echo http://carts.sockshop-dev.$(kubectl -n keptn get ingress api-keptn-ingress -ojsonpath='{.spec.rules[0].host}')echo http://carts.sockshop-staging.$(kubectl -n keptn get ingress api-keptn-ingress -ojsonpath='{.spec.rules[0].host}')echo http://carts.sockshop-production.$(kubectl -n keptn get ingress api-keptn-ingress -ojsonpath='{.spec.rules[0].host}') - Navigate to
http://carts.sockshop-production.YOUR.DOMAINfor viewing the carts service in your production environment and you should receive an output similar to the following:

- Use the Keptn CLI to deploy a version of the carts service, which contains an artificial slowdown of 1 second in each request.
keptn trigger delivery --project=sockshop --service=carts --image=docker.io/keptnexamples/carts --tag=0.13.2 - Verify that the slow build has reached your
devandstagingenvironments by opening a browser for both environments. This may take 5 to 10 minutes. Get the URLs with these commands:echo http://carts.sockshop-dev.$(kubectl -n keptn get ingress api-keptn-ingress -ojsonpath='{.spec.rules[0].host}')echo http://carts.sockshop-staging.$(kubectl -n keptn get ingress api-keptn-ingress -ojsonpath='{.spec.rules[0].host}')
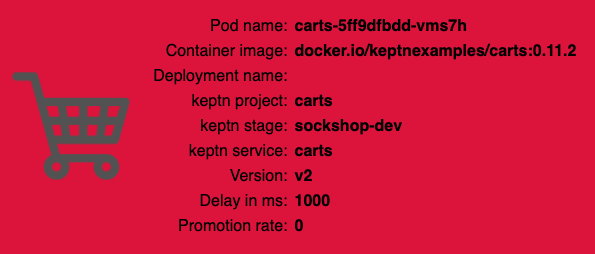
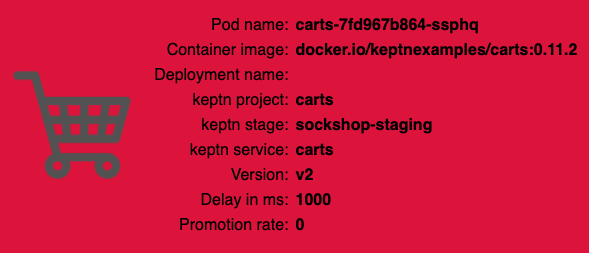
After triggering the deployment of the carts service in version v0.13.2, the following status is expected:
- Dev stage: The new version is deployed in the dev stage and the functional tests passed.
- To verify, open a browser and navigate to:
echo http://carts.sockshop-dev.$(kubectl -n keptn get ingress api-keptn-ingress -ojsonpath='{.spec.rules[0].host}')
- To verify, open a browser and navigate to:
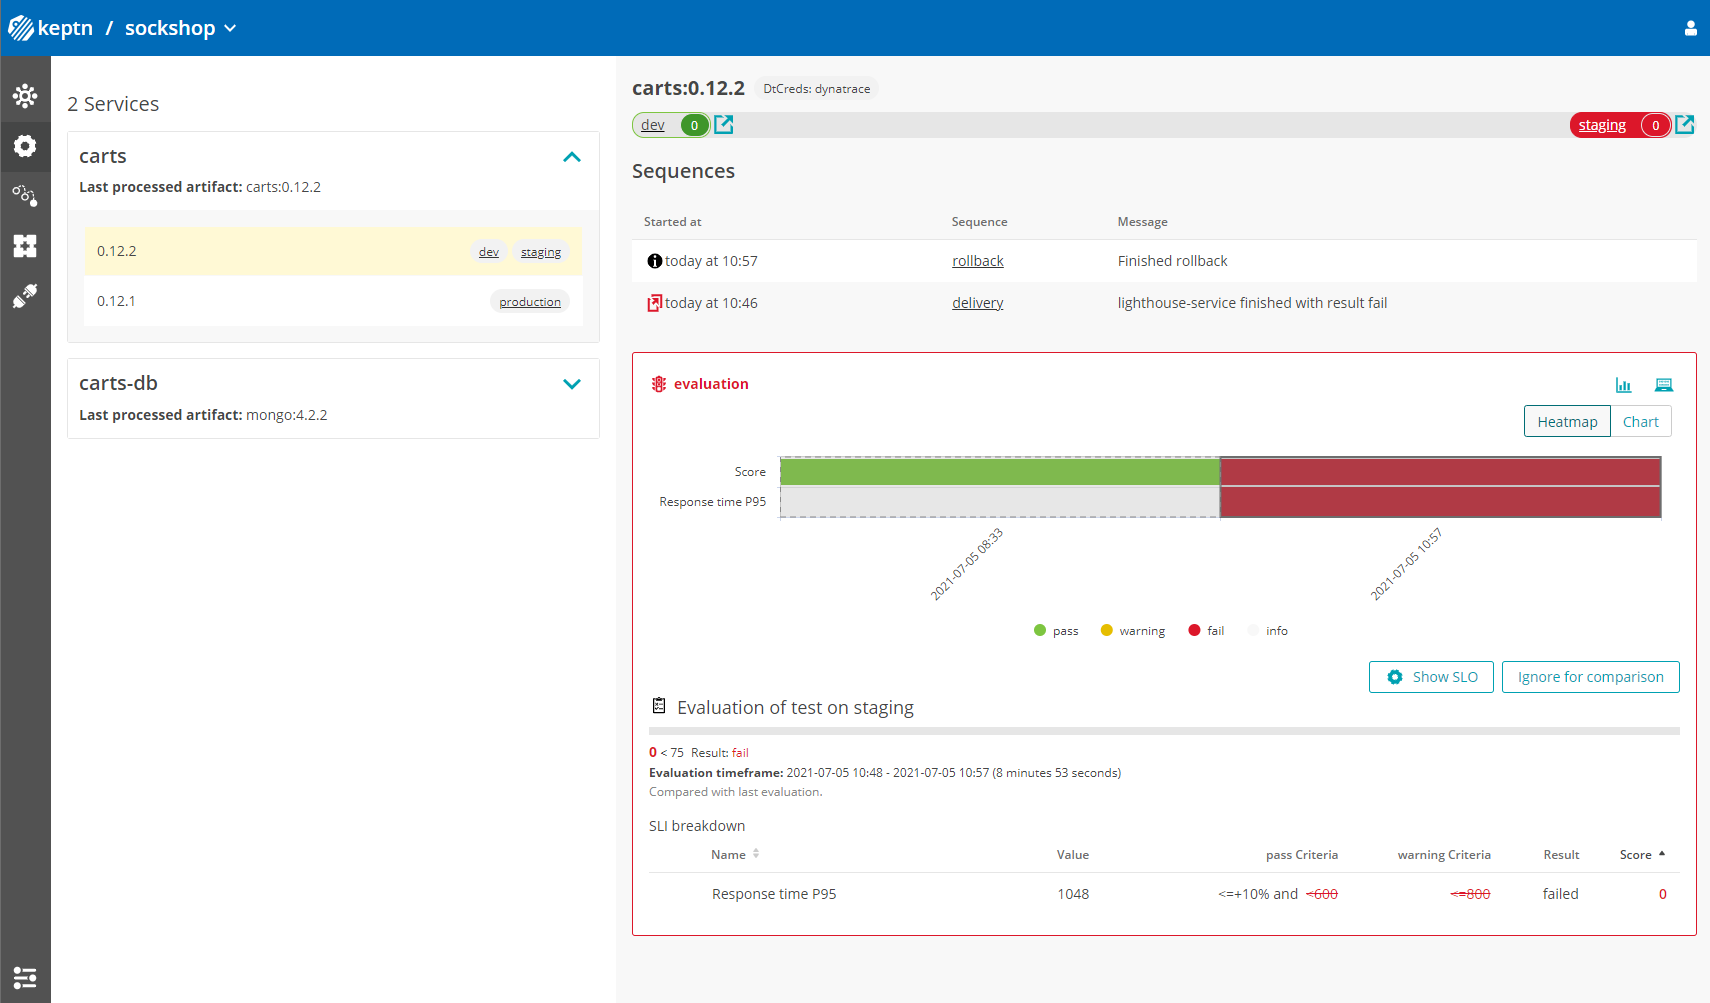
- Staging stage: In this stage, version v0.13.2 will be deployed and the performance test starts to run for about 10 minutes. After the test is completed, Keptn triggers the test evaluation and identifies the slowdown. Consequently, a roll-back to version v0.13.1 in this stage is conducted and the promotion to production is not triggered.
- Production stage: The slow version is not promoted to the production stage because of the active quality gate in place. Thus, still version v0.13.1 is expected to be in production.
- To verify, navigate to:
echo http://carts.sockshop-production.$(kubectl -n keptn get ingress api-keptn-ingress -ojsonpath='{.spec.rules[0].host}')
- To verify, navigate to:
Take a look in the Keptn's bridge and navigate to the last deployment. You will find a quality gate evaluation that got a fail result when evaluation the SLOs of our carts microservice. Thanks to this quality gate the slow build won't be promoted to production but instead automatically rolled back.
To verify, the Keptn's Bridge shows the deployment of v0.13.2 and then the failed test in staging including the roll-back.
- Use the Keptn CLI to send a new version of the carts artifact, which does not contain any slowdown:
keptn trigger delivery --project=sockshop --service=carts --image=docker.io/keptnexamples/carts --tag=0.13.3 - To verify the deployment in production (it may take a couple of minutes), open a browser and navigate to the carts service in your production environment. As a result, you see
Version: v3. - Besides, you can verify the deployments in your Kubernetes cluster using the following commands:
kubectl get deployments -n sockshop-productionNAME DESIRED CURRENT UP-TO-DATE AVAILABLE AGE carts-db 1 1 1 1 63m carts-primary 1 1 1 1 98mkubectl describe deployment carts-primary -n sockshop-production... Pod Template: Labels: app=carts-primary Containers: carts: Image: docker.io/keptnexamples/carts:0.13.3 - Take another look into the Keptn's Bridge and you will see this new version passed the quality gate and thus, is now running in production!
Next, you will learn how to use the capabilities of Keptn to provide self-healing for an application without modifying code. In the next part, we configure Keptn to scale up the pods of an application if the application undergoes heavy CPU saturation.
For this usecase, we have prepared another version of the SLI file. Add it with the following command:
keptn add-resource --project=sockshop --stage=production --service=carts --resource=sli-config-prometheus-selfhealing.yaml --resourceUri=prometheus/sli.yaml
Add the prepared SLO file for self-healing to the production stage using the Keptn CLIs add-resource command:
keptn add-resource --project=sockshop --stage=production --service=carts --resource=slo-self-healing-prometheus.yaml --resourceUri=slo.yaml
Note: The SLO file contains an objective for response_time_p90.
Configure Prometheus with the Keptn CLI (this configures the Alert Manager based on the slo.yaml file):
keptn configure monitoring prometheus --project=sockshop --service=carts
Configure remediation actions for up-scaling based on Prometheus alerts:
keptn add-resource --project=sockshop --stage=production --service=carts --resource=remediation.yaml --resourceUri=remediation.yaml
This is the content of the file that has being added:
apiVersion: spec.keptn.sh/0.1.4
kind: Remediation
metadata:
  name: carts-remediation
spec:
  remediations:
    - problemType: Response time degradation
      actionsOnOpen:
        - action: scaling
          name: scaling
          description: Scale up
          value: 1
    - problemType: response_time_p90
      actionsOnOpen:
        - action: scaling
          name: scaling
          description: Scale up
          value: 1
To simulate user traffic that is causing an unhealthy behavior in the carts service, please execute the following script. This will add special items into the shopping cart that cause some extensive calculation.
- Move to the correct folder for the load generation scripts:
cd ../load-generation/cartsloadgen/deploy - Start the load generation script:
kubectl apply -f cartsloadgen-faulty.yaml - (optional:) Verify the load in Prometheus.
- Make a port forward to access Prometheus:
kubectl port-forward svc/prometheus-server 8080:80 -n monitoring - Access Prometheus from your browser on http://localhost:8080.
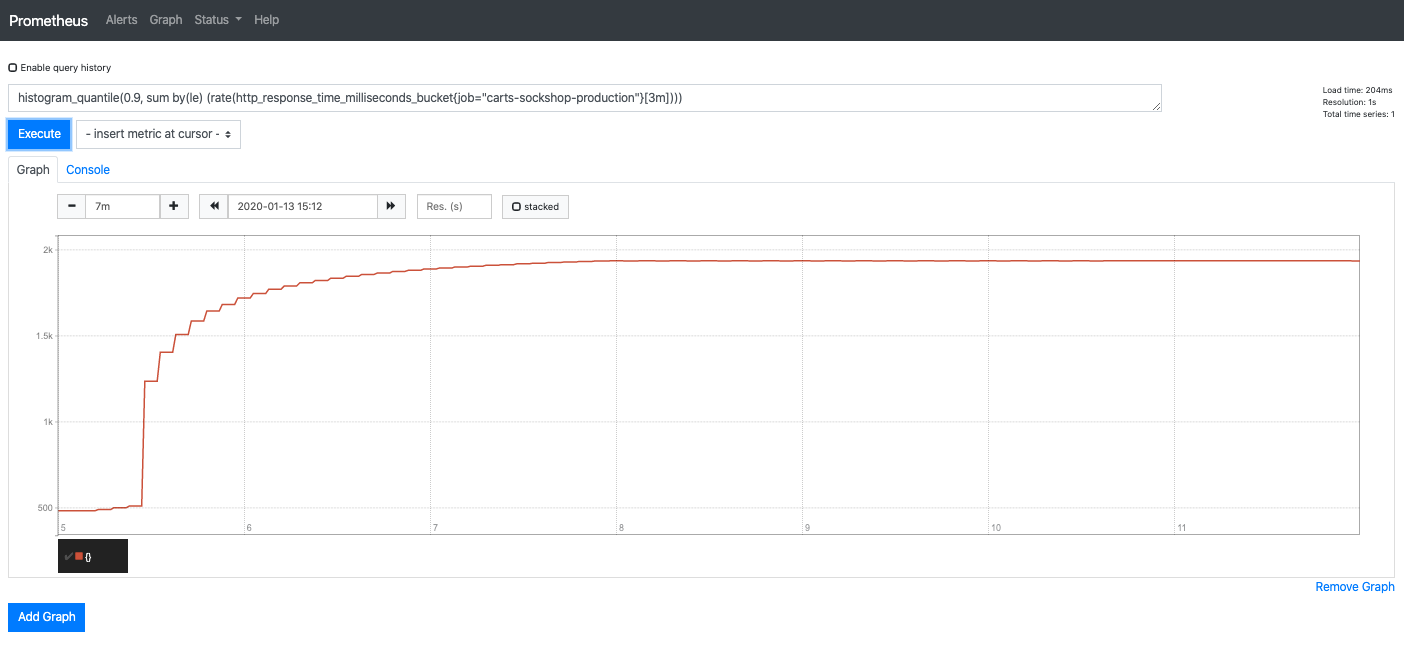
- In the Graph tab, add the expression
histogram_quantile(0.9, sum by(le) (rate(http_response_time_milliseconds_bucket{job="carts-sockshop-production-primary"}[3m]))) - Select the Graph tab to see your Response time metrics of the
cartsservice in thesockshop-productionenvironment. - You should see a graph which locks similar to this:
- Make a port forward to access Prometheus:
After approximately 10-15 minutes, the Alert Manager will send out an alert since the service level objective is not met anymore.
To verify that an alert was fired, select the Alerts view where you should see that the alert response_time_p90 is in the firing state:
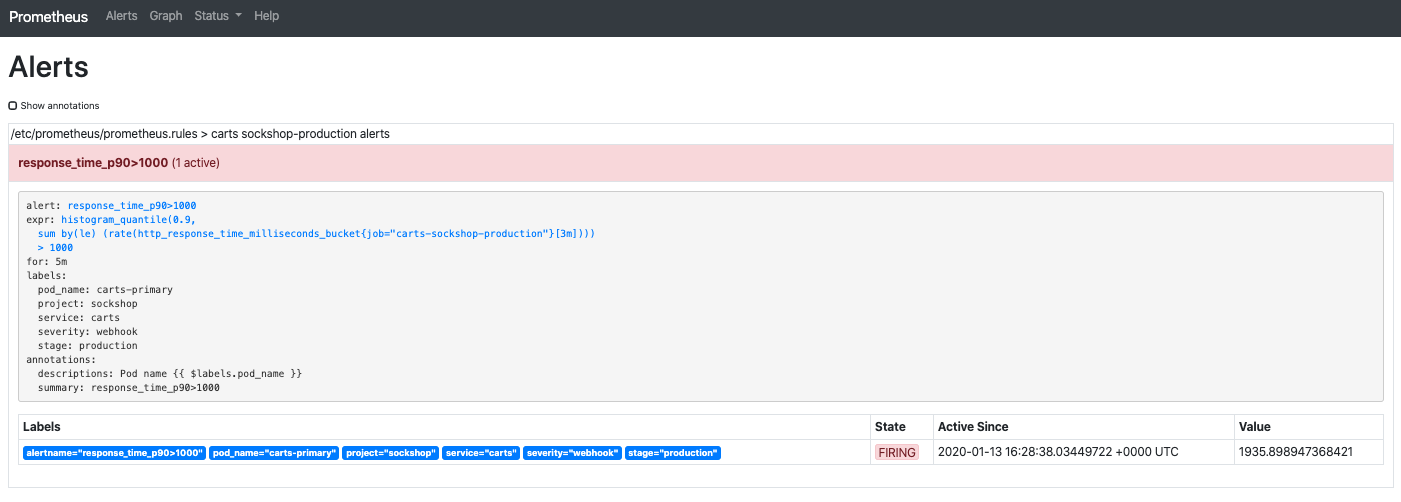
After receiving the alert notification, the prometheus-service will translate it into a Keptn CloudEvent. This event will eventually be received by the remediation-service that will look for a remediation action specified for this type of problem and, if found, execute it.
In this tutorial, the number of pods will be increased to remediate the issue of the response time increase.
- (time saving opition) Instead of waiting 15 minutes for the Alert Manager to fire an alert, you can manually send the trigger of a remediation sequence by executing the following commands:
echo -e "{\"type\": \"sh.keptn.event.production.remediation.triggered\",\"specversion\":\"1.0\",\"source\":\"https:\/\/github.com\/keptn\/keptn\/prometheus-service\",\"id\": \"f2b878d3-03c0-4e8f-bc3f-454bc1b3d79d\", \"time\": \"2019-06-07T07:02:15.64489Z\", \"contenttype\": \"application\/json\", \"data\": {\"project\": \"sockshop\",\"stage\": \"production\",\"service\": \"carts\",\"problem\": { \"problemTitle\": \"response_time_p90\",\"rootCause\": \"Response time degradation\"}}}" > remediation_trigger.json | keptn send event -f remediation_trigger.json
This command sends the following event to Keptn to:
   {
     "type": "sh.keptn.event.production.remediation.triggered",
     "specversion": "1.0",
     "source": "https://github.com/keptn/keptn/prometheus-service",
     "id": "f2b878d3-03c0-4e8f-bc3f-454bc1b3d79d",
     "time": "2019-06-07T07:02:15.64489Z",
     "contenttype": "application/json",
     "data": {
       "project": "sockshop",
       "stage": "production",
       "service": "carts",
       "problem": {
         "problemTitle": "response_time_p90",
         "rootCause": "Response time degradation"
       }
     }
   }
- Check the executed remediation actions by executing:
You can see that thekubectl get deployments -n sockshop-productioncarts-primarydeployment is now served by two pods:NAME DESIRED CURRENT UP-TO-DATE AVAILABLE AGE carts-db 1 1 1 1 37m carts-primary 2 2 2 2 32m - Also you should see an additional pod running when you execute:
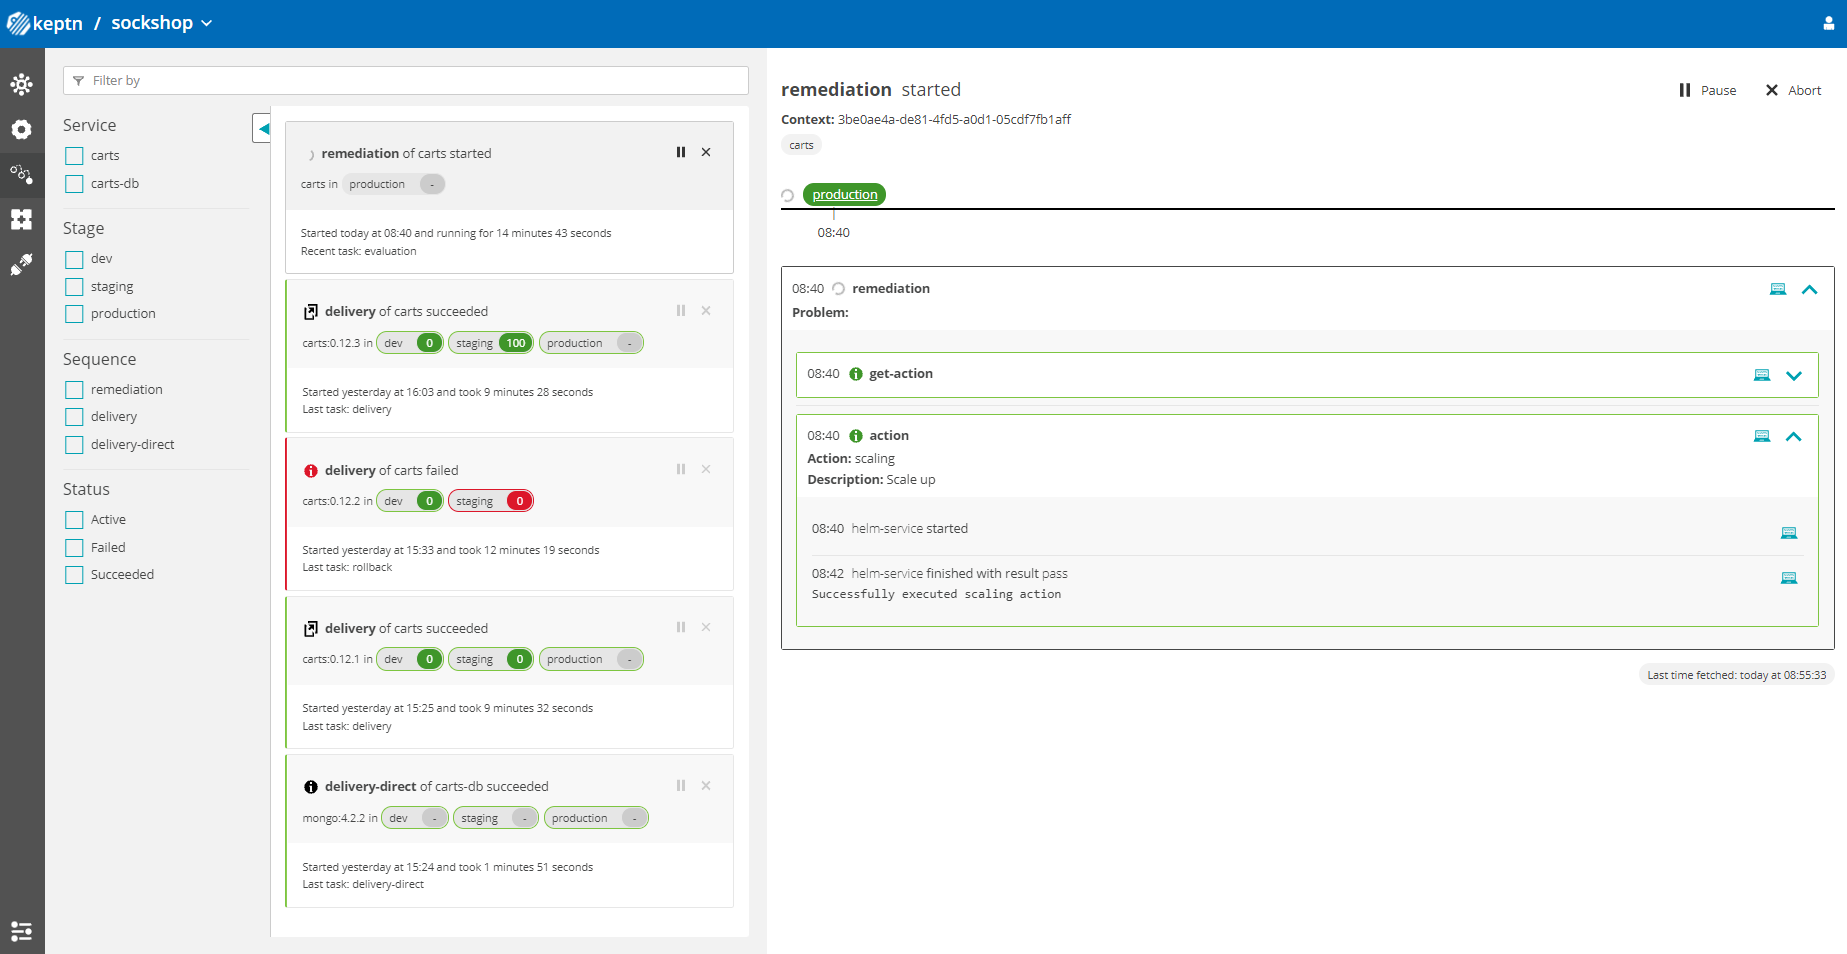
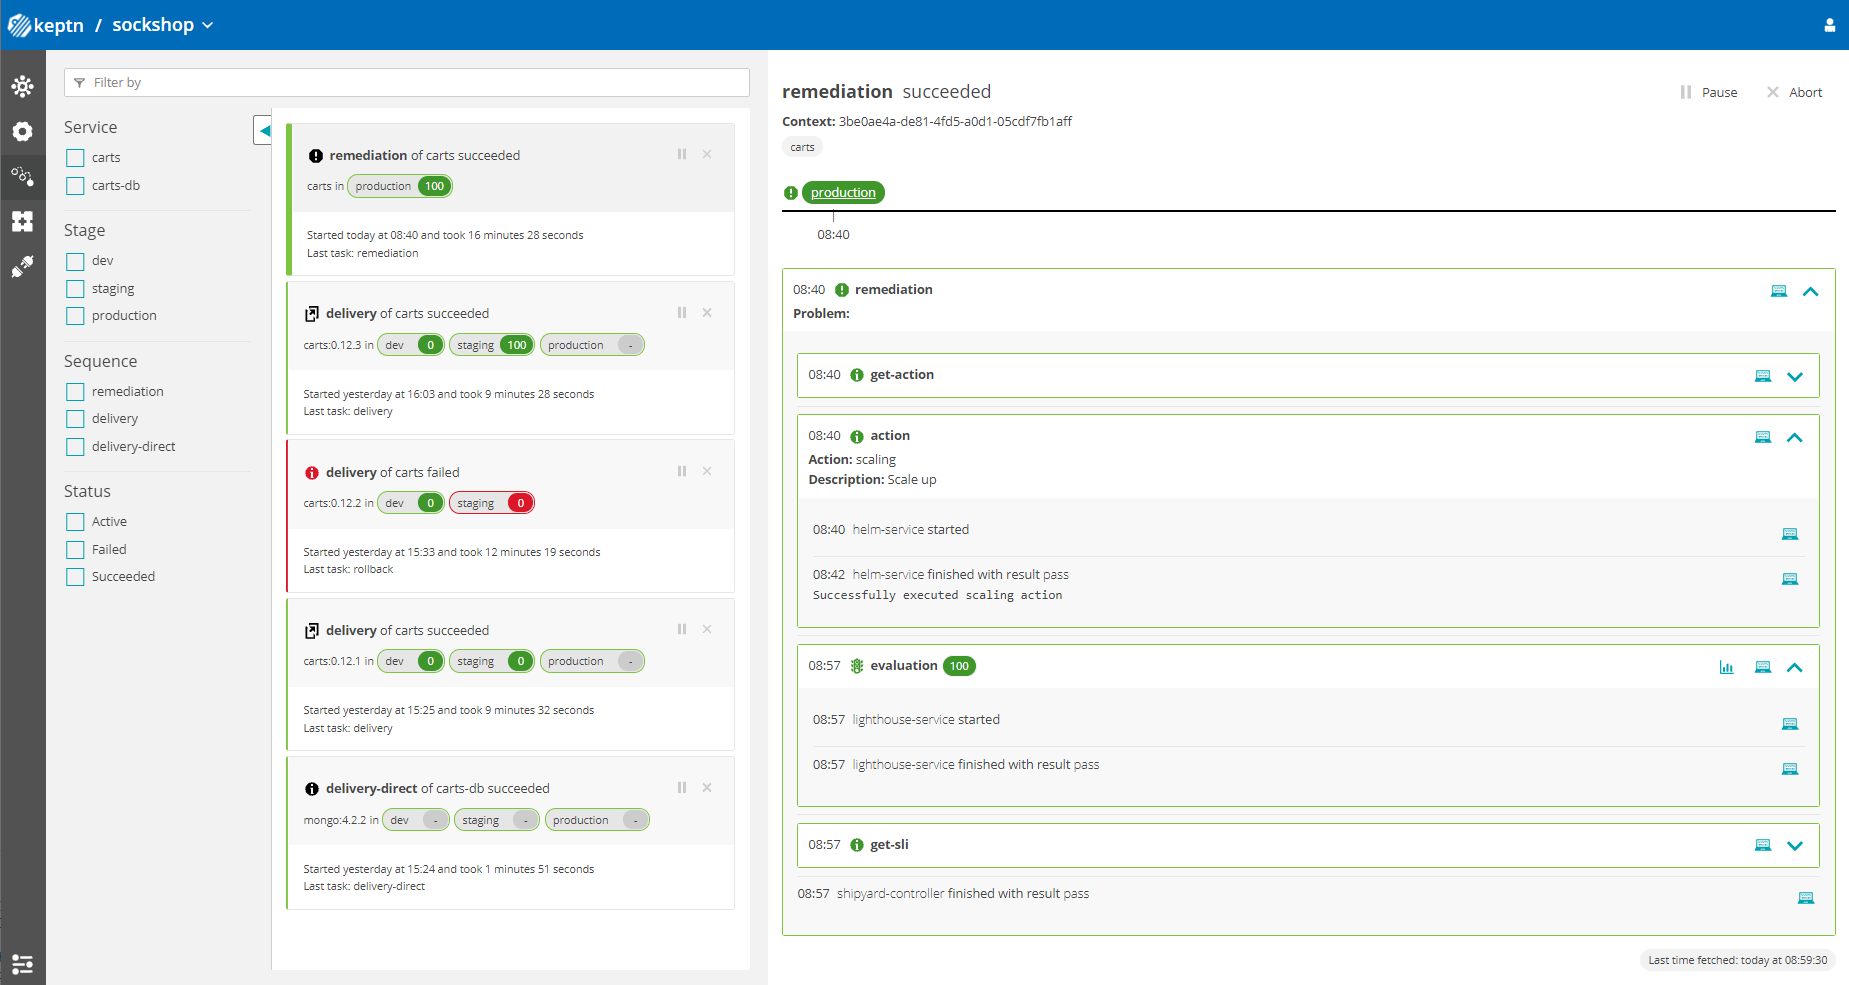
kubectl get pods -n sockshop-productionNAME READY STATUS RESTARTS AGE carts-db-57cd95557b-r6cg8 1/1 Running 0 38m carts-primary-7c96d87df9-75pg7 2/2 Running 0 33m carts-primary-7c96d87df9-78fh2 2/2 Running 0 5m - To get an overview of the actions that got triggered by the response time SLO violation, you can use the Keptn's Bridge.In this example, the bridge shows that the remediation service triggered an update of the configuration of the carts service by increasing the number of replicas to 2. When the additional replica was available, the wait-service waited for ten minutes for the remediation action to take effect. Afterwards, an evaluation by the lighthouse-service was triggered to check if the remediation action resolved the problem. In this case, increasing the number of replicas achieved the desired effect, since the evaluation of the service level objectives has been successful.
- Furthermore, you can use Prometheus to double-check the response time:
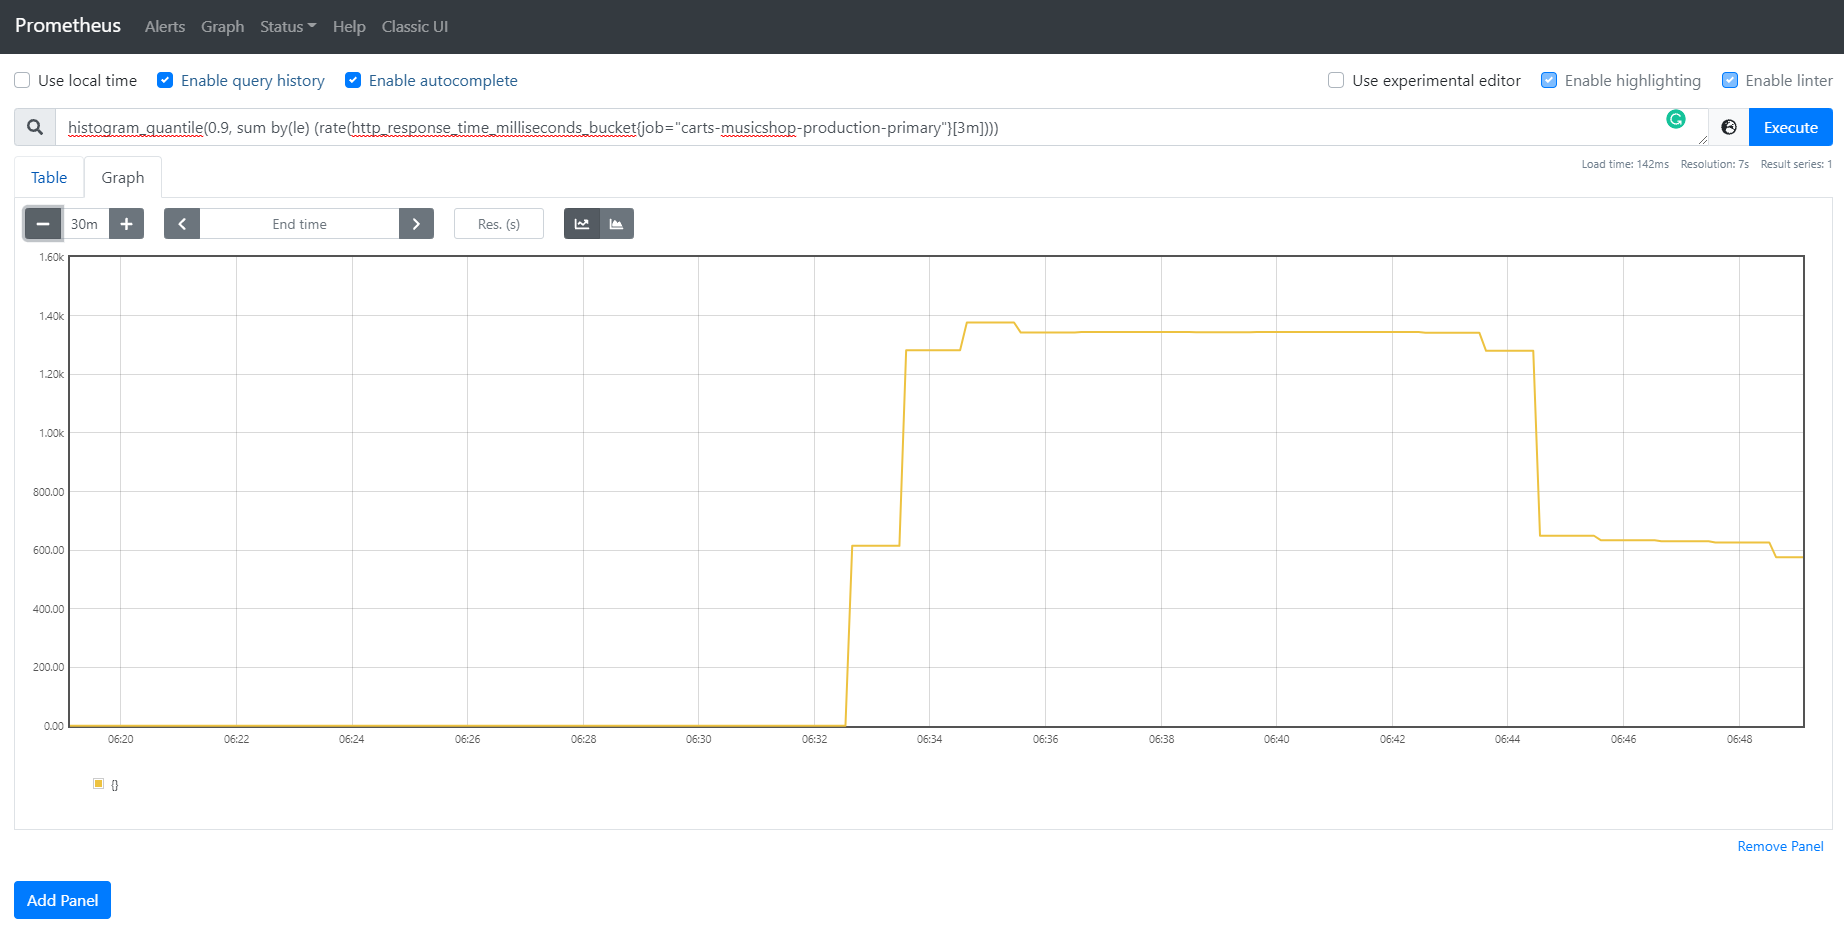
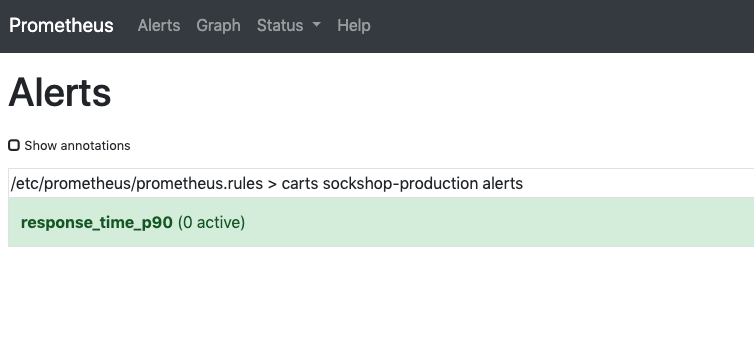
- Also, the Prometheus Alert Manager will show zero active alerts.
Thanks for taking a full tour through Keptn!
Although Keptn has even more to offer that should have given you a good overview what you can do with Keptn.
What we've covered
- We have created a sample project with the Keptn CLI and set up a multi-stage delivery pipeline with the
shipyardfileapiVersion: "spec.keptn.sh/0.2.0" kind: "Shipyard" metadata: name: "shipyard-sockshop" spec: stages: - name: "dev" sequences: - name: "artifact-delivery" tasks: - name: "deployment" properties: deploymentstrategy: "direct" - name: "test" properties: teststrategy: "functional" - name: "evaluation" - name: "release" - name: "artifact-delivery-db" tasks: - name: "deployment" properties: deploymentstrategy: "direct" - name: "release" ... - We have set up quality gates based on service level objectives in our
slofile--- spec_version: "1.0" comparison: aggregate_function: "avg" compare_with: "single_result" include_result_with_score: "pass" number_of_comparison_results: 1 filter: objectives: - sli: "response_time_p95" key_sli: false pass: # pass if (relative change <= 10% AND absolute value is < 600ms) - criteria: - "<=+10%" # relative values require a prefixed sign (plus or minus) - "<600" # absolute values only require a logical operator warning: # if the response time is below 800ms, the result should be a warning - criteria: - "<=800" weight: 1 total_score: pass: "90%" warning: "75%" - We have tested our quality gates by deploying a bad build to our cluster and verified that Keptn quality gates stopped them.

Keptn can be easily extended with external tools such as notification tools, other SLI providers, bots to interact with Keptn, etc.
While we do not cover additional integrations in this tutorial, please feel fee to take a look at our integration repositories:
- Keptn Contrib lists mature Keptn integrations that you can use for your Keptn installation
- Keptn Sandbox collects mostly new integrations and those that are currently under development - however, you can also find useful integrations here.
Please visit us in our Keptn Slack and tell us how you like Keptn and this tutorial! We are happy to hear your thoughts & suggestions!
Also, make sure to follow us on Twitter to get the latest news on Keptn, our tutorials and newest releases!